Is Now a Good Time to Buy and Sell

Article by Rightmove
Millions of you have started home-hunting again since the government eased certain lockdown restrictions in England.
We saw our busiest ever day on Wednesday 27th May, surpassing six million visits for the first time, which is up 18% on the same Wednesday in May last year.
But what does all this activity mean for you and your own move? Here, we break down some of the key stats and trends to help you understand if now is a good time to buy and sell.
What are the headline figures?
The first thing to note is that the reopening of the market has released lots of pent-up demand, meaning that many people are now pressing ahead with their plans to move.
Specifically, we have seen that:
- Huge numbers of you are phoning and emailing estate agents through our website. On our busiest day ever, 27th May, we saw an 18% rise in this activity compared with the same day last year
- The busiest day for time spent on our website was Saturday 23rd May, with over 47 million minutes spent collectively
- Over a quarter of people (28%) who were not planning a move before lockdown are now entering the market
- The number of sales being agreed by agents is slowly starting to pick up, but will take time. This figure is 47% down on last year, an improvement on the 90% down when the market paused
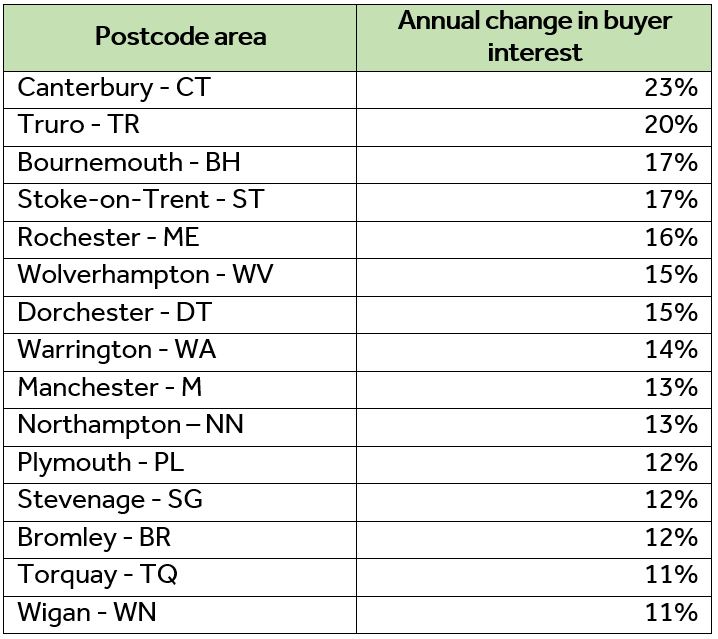
- Coastal areas of Cornwall, Devon and Bournemouth are seeing the biggest jump in buyer interest, plus northern locations such as Warrington, Manchester and Wigan
What do the experts say?
Our resident property expert Miles Shipside, one of our founding directors and a BBC News regular, explained that the market has seen a late spring boost as a result of certain restrictions being eased.
He said: “Usually we record our busiest days of the year in January and February and almost never when there is warm weather, so the combination of pent-up demand being released, new people entering the market and no half-term holidays during lockdown has led to this late spring boost.
“The challenge agents are facing is handling this surge in enquiries, having a process to deliver virtual viewings, and setting up socially distanced and safe physical viewings.
“This means that although numbers of sales agreed have improved from being down 90% to currently being 47% down compared to this time last year, it’s going to take a considerable time for a return to sales agreed levels seen last year and at the start of this year.
“Areas with beautiful scenery and a potentially quieter life are proving to be popular as home-movers’ priorities start to shift, and outside space becomes more important.
“There are also those considering a move further out now that they’ve realised they can work out of the office and may be finding they can get a lot more for their money in some of the South West and Northern locations.”
Where are most people interested in buying?
The areas with strongest interest from buyers compared to last year – measured by the number of times things like floor plans, pictures and videos are viewed – include places along the south coast and northern towns and cities.
The biggest changes compared to last year are in the CT postcode area of Canterbury, followed by the TR postcode which makes up around half of the places in Cornwall, and Bournemouth.

You can read the rest of the article at https://bit.ly/2U9txtV

